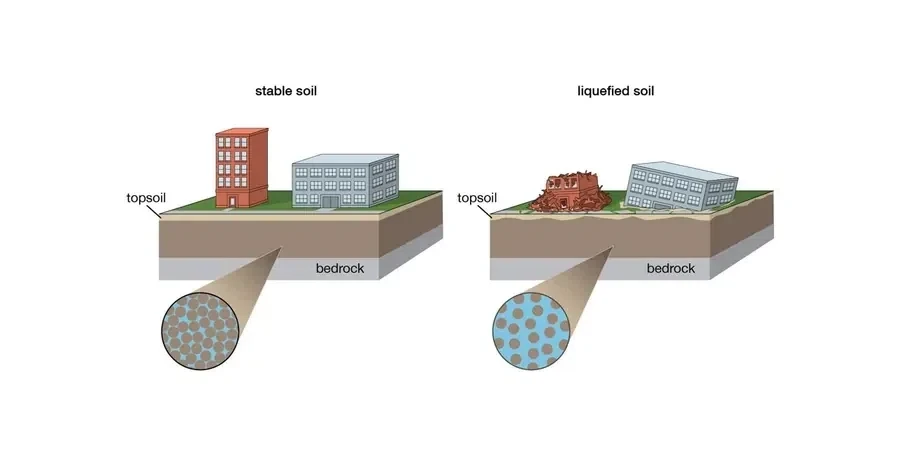
The Tees Valley sits on deep alluvial deposits laid down by post-glacial rivers, and Middlesbrough's industrial legacy means much of the ground is reclaimed or soft. When seismic shaking hits these saturated sands and silts, pore pressure can spike fast and turn solid ground into a fluid mass. That is why a proper soil liquefaction analysis in Middlesbrough is not optional for any project near the river or the docks. We combine SPT blow counts with cyclic stress ratios from the Youd-Idriss 2001 procedure, then cross-check with laboratory cyclic triaxial tests on undisturbed samples. Before we run the full analysis, we often recommend a MASW-Vs30 survey to profile shear-wave velocity across the site, which gives us the NEHRP site class directly. This layered approach ensures we catch loose lenses that could trigger differential settlement under even moderate ground motion.
On Teesside alluvium, a factor of safety below 1.2 means the soil can liquefy under a magnitude 5.5 event.
Technical details of the service in Middlesbrough
Critical ground factors in Middlesbrough
In Middlesbrough we often see that the loose Holocene sands beneath the old docklands have low N-values and high fines content — a combination that amplifies pore-pressure buildup. A site near the Riverside Stadium showed a factor of safety of 0.85 at 4 m depth for a magnitude 5.0 event, meaning the soil would likely lose all strength during shaking. The risk is not just during the earthquake: post-liquefaction consolidation can cause 150 mm of differential settlement across a raft foundation. We always flag these zones early and recommend Improvement like stone columns or deep soil mixing before any foundation work begins.
Our services
We deliver a complete liquefaction assessment package for Middlesbrough projects, from field sampling to mitigation design. Each service is tailored to Teesside geology and UK seismic codes.
SPT-based liquefaction analysis
Borehole SPT at 1.5 m intervals with N60 corrections, fines content from wash sieving, and CSR/CRR computation per NCEER 1997. Output includes factor of safety profiles and liquefaction potential index.
Cyclic triaxial testing
Undisturbed thin-walled tube samples tested under cyclic loading at frequencies 0.1-1 Hz. Reports include cyclic strength curves, pore-pressure generation, and modulus reduction.
Vs30 profiling for site classification
MASW survey with 24-channel geophone array to measure shear-wave velocity to 30 m depth. Determines NEHRP site class (E for Middlesbrough alluvium) and seismic site response.
Improvement design
If liquefaction risk is confirmed, we design stone columns, vibrocompaction, or deep soil mixing to increase density and drainage. Includes settlement and bearing capacity checks post-treatment.
Q&A
What is the difference between liquefaction potential index (LPI) and factor of safety?
Factor of safety (FS) is calculated at each depth as CRR divided by CSR; an FS below 1.0 indicates likely liquefaction. LPI integrates the FS over the entire profile, weighting by layer thickness and severity, giving a single number (0-100) that ranks the overall site hazard. In Middlesbrough alluvium, LPI values above 15 often trigger mandatory mitigation.
How much does a soil liquefaction analysis cost for a typical Middlesbrough site?
For a standard residential or commercial plot of 0.5-1.0 hectares, the complete analysis including 4-6 SPT boreholes, cyclic triaxial tests, and Vs30 profiling ranges between £1,880 and £3,190. This covers field mobilisation, laboratory testing, and a full report with FS profiles and mitigation recommendations. Larger sites or deeper boreholes increase the cost.
Which Middlesbrough areas have the highest liquefaction risk?
The highest risk zones are the reclaimed docklands along the Tees (Port Clarence, North Shore), the alluvial flats around Acklam, and infilled channels near the Riverside. These areas typically have loose to very loose sands with N60 values below 10 and high groundwater within 2 m of the surface. Sites on boulder clay (e.g., Marton, Coulby Newham) are generally non-liquefiable.
Can I use CPT data instead of SPT for liquefaction analysis?
Yes, CPT is widely accepted for liquefaction assessment using the Robertson & Wride 1998 method. The cone tip resistance (qc) and sleeve friction (fs) are correlated to cyclic resistance. In Middlesbrough alluvium, CPT offers continuous profiling and is faster than SPT, but the fines content must be estimated from the soil behaviour type index (Ic) or verified with occasional SPT samples.